In a recent blog post, Fortinet discussed a new version of Poison Ivy[1] spreading through malicious PowerPoint files.
The PowerPoint file includes a .NET loader in a stream which goes on to load a variant of Poison Ivy. But there is some debate regarding whether this is a pure Poison Ivy variant or a hybrid of PlugX and Poison Ivy code, as reported by JPCERT in February[2].
For a detailed analysis, the Fortinet blog shares some good details and for that reason, I am not going to go over those again here. The purpose of this blog is show how you can analyse the downloaded sample and understand what the Poison Ivy code is doing.
The .NET file
If we open the PowerPoint file (SHA256: ea13ef8cb5f227080ebf65daa6644f66807aa8f06dce2155d40de556367221ee) in a hex editor, we can see the MZ header at offset 0x6000h.
I just cropped that MZ and got the .NET file (SHA256: a098798b4ba34758b4431e4cdbfc668869d82999e0aaaa639033fe188425b477), but there many ways to extract the sample using other tools.
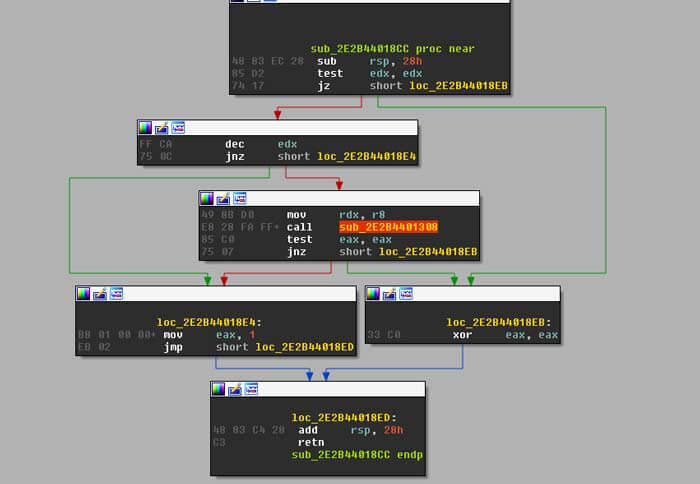
As you can see in the image below, the loader checks for the vmtoolsd process and exits if found. This is just to check if it’s running on VMWare.
It then proceeds to check for taskhost.exe in C:Windowstasks and bails if found. So, if you want to stop this loader just create a file called taskhost.exe in that directory!
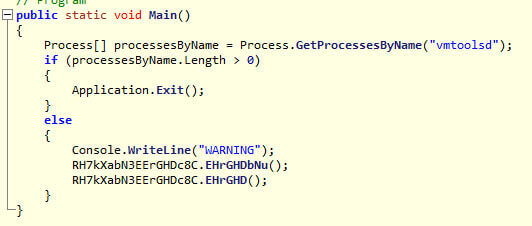
If not found, the loader will copy itself there and maintain persistence by installing a run key called Debugtask that points to taskhost.exe.
But that’s boring. It gets interesting from the second call, where a byte array gets loaded in memory and executed using CreateThread. There are two ways we can retrieve this shellcode: dynamically or statically.
Statically, we can just copy paste the byte array into a new file and use a few lines of Python to dump the bytes.
bytes = [ 72, 49, 201,…]
dump = ”.join(chr(x) for x in bytes)
with open(‘shellcode.bin’, ‘wb’) as fh:
fh.write(dump)
Dynamically using WinDbg we can set a breakpoint on the CreateThread API and `!address` on the address provided as the StartAddress in order to get the start and size of the memory region. Then we can use `.writemem` to dump that region out.
There was a great walkthrough of how to use WinDbg to unpack .NET malware by Talos[3]. However, it would be overkill in this scenario to debug since we can just extract the shellcode statically.
The shellcode: Stage one
Now the fun begins.
Opening up the shellcode in IDA 64, we can see that it’s self decoding. Before we jump into writing a decoder it would be wise to step through this shellcode with a debugger, since we will need to do that anyway further down the line.
In order to step through it we need a shellcode loader. A nice trick is to add a `0xCC` byte (int 3) at the start of the shellcode in order to breakpoint on start. I use a simple shellcode loader that allocates memory and copies bytes into that region to start execution.
It’s not ideal, since if the shellcode starts from an offset inside the region rather than the beginning then you would have to change the EIP and stack (especially if there are arguments passed to the thread ). But this is not the case here, so a simple int 3 at the start of the shellcode will suffice.
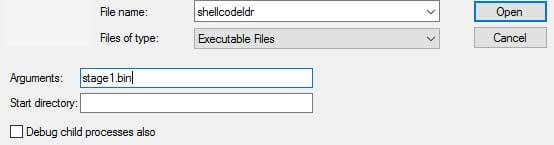
We start by opening the shellcodeldr.exe and supplying our dumped bin as an argument to it (since this is how shellcodeldr.exe works).
Once loaded, WinDbg will break so we let it resume (press F5 or ‘g’) until it hits our breakpoint, as seen below.
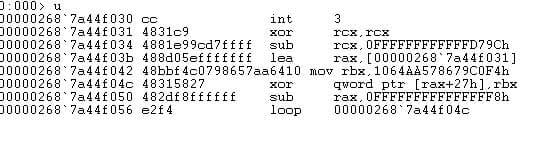
As you can see, the shellcode starts decoding itself by XORing the bytes from offset 27 with the key in rbx for rcx bytes. The shellcode uses the negative values throughout to obfuscate the actual number of bytes the loop runs for. In this case, the size of the bytes is 2864.
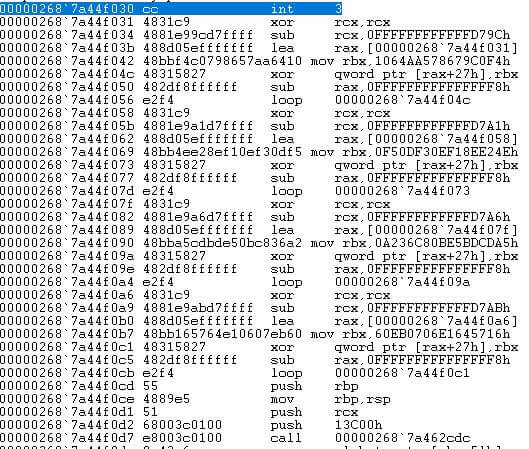
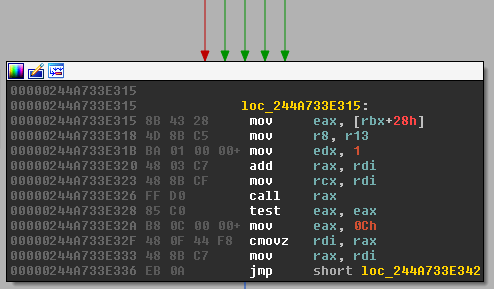
If we step over the loop (F10) then, lo and behold, another XOR loop is found. After multiple XOR loops (as seen below) we can finally see something different: the call to a function.
After we get this far, it might be wise to just get a full dump from memory so we can statically look at the file in IDA.
The shellcode: Stage two
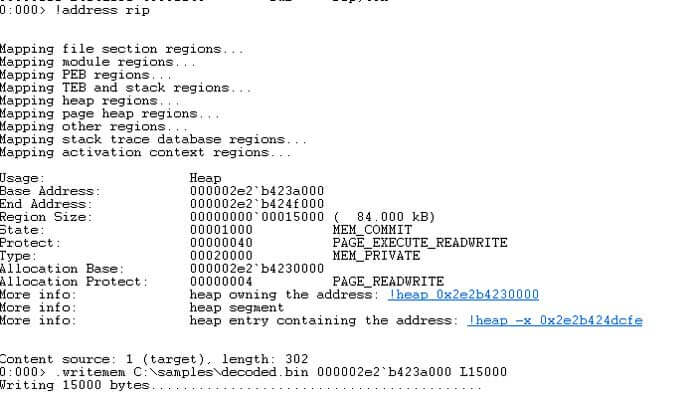
When opening the decoded dump in IDA we will need to rebase it. We need to use the base address of the memory region and we can get this by running `!address rip` in WinDbg. In this case it’s 0x2e2b423a000. This will be different every time unless you can dictate the allocated address start for the shellcode.
Following the decoded shellcode, we will finally see a read from gs:60 and then a read from offset 0x18 in that address. This should automatically give you some hints about what the shellcode will be doing next.
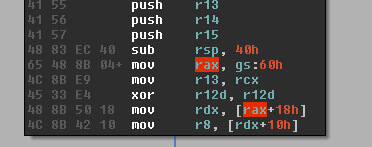
The shellcode is trying to access the _PEB_LDR_DATA to walk the list of loaded modules in the current process. This is a standard technique to manually resolve API addresses for imports from Windows libraries to use later by the shellcode. You could verify that by stepping through the code yourself or you could also breakpoint on LoadLibrary and GetProcAddress to list all imports.
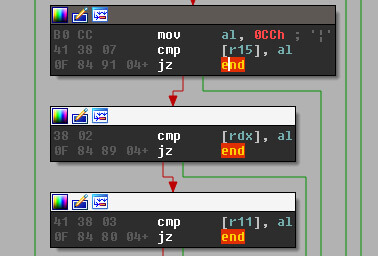
Before you go ahead and set a breakpoint on LoadLibrary, the shellcode does some checks for `0xCC` bytes on the prologue of the APIs before calling them and bails if found; a simple anti-debugging trick.
So, you can either break on execution using a hardware breakpoint or just step through and you will see the distinctive calls.
Towards the end of the shellcode there is the call to the final payload using a `call rax`. This will transfer us to a newly allocated region of memory. We can go ahead and set a breakpoint there. But we also want to know what libraries are loaded and which APIs will be resolved.
We can use the following commands in WinDbg to help:
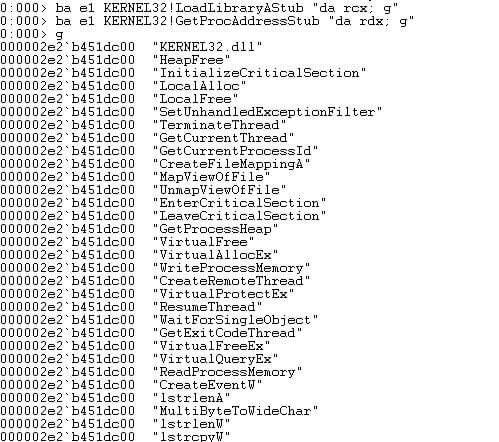
• ba e1 kernel32!LoadLibraryAStub “da rcx; g”
• ba e1 kernel32!GetProcAddressStub “da rdx; g”
The first breakpoint will show us all the library names passed to LoadLibrary being loaded by the shellcode, while the second will show us all the API names being passed to GetProcAddress to be resolved.
If we step through the `call rax` we now get our payload: the Poison Ivy code. Finally!
But we need to dump out that newly allocated PAGE_EXECUTE_READWRITE memory.
So, similar to earlier, we will use `!address` to find the region size and dump it out using `.writemem`.
Again, note the base address to rebase the binary file in IDA. The size of that payload for this sample should be 0x11e000 bytes.
Poison Ivy code
When we dump the memory out and open it in IDA, we will see something similar to the below at the address rax was pointing to:
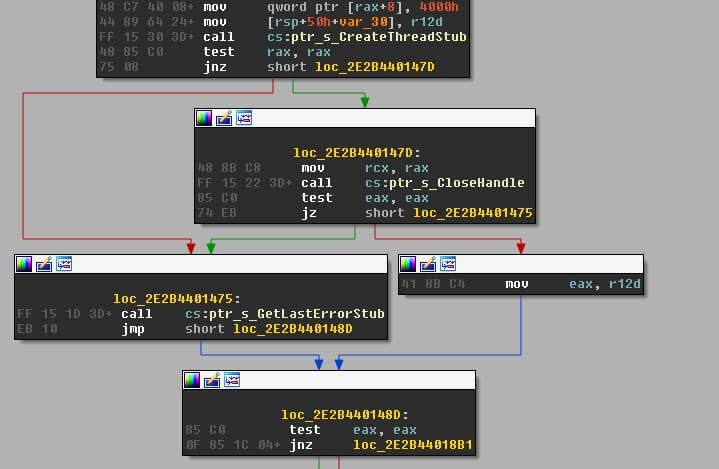
Following the call there you will notice calls to table offsets like the one below. If you follow through you will finally see a jmp to an address. These are the API calls, but Poison Ivy uses the negative value of the address and creates a table of all these different calls.
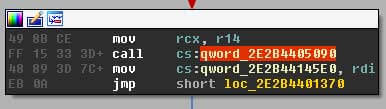

This technique is explained in the Fortinet blog. There is a resolver stub for each API that starts with the negative address of the API passed into rax, which is then negated, followed by the jump to the API start address.
So, in order for us to have a better understanding of what the payload is doing statically we need to write an IDAPython script that will take the addresses of all the APIs, multiply them by minus one and create enumerations in IDA to be able to resolve the APIs. We will also need to fix the names of the offsets in that table to be meaningful and obtain the symbols and their addresses from the current process in WinDbg.
Since we know which DLLs were being loaded by the shellcode from our previous breakpoint, we can just grab the symbols from those DLLs using the following commands:
• .shell -i- -ci “x kernel32!*” findstr “!”>kernel32.txt
• .shell -i- -ci “x user32!*” findstr “!”>user32.txt
• .shell -i- -ci “x ws2_32!*” findstr “!”>ws2_32.txt
• .shell -i- -ci “x advapi32!*” findstr “!”>advapi32.txt
• .shell -i- -ci “x ntdll!*” findstr “!”>ntdll.txt
IDAPython script
I wrote a script that helps us analyse this sample, which is available in our GitHub repository[4]. The script uses the symbol text files we dumped earlier from WinDbg in order to create enumerations for the negative API address values used. In this walkthrough, I have put the symbols in the directory C:analysissymbols.
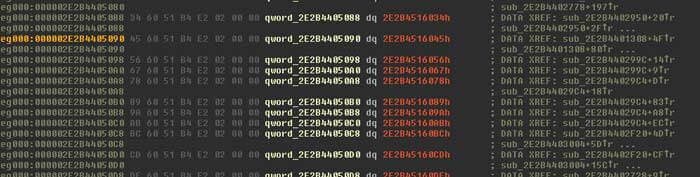
On loading the dumped Poison Ivy code in IDA, you can find the table of API calls by scrolling to the first call to offset. If you follow the offset and scroll up, we can find the start of the import address table of Poison Ivy.
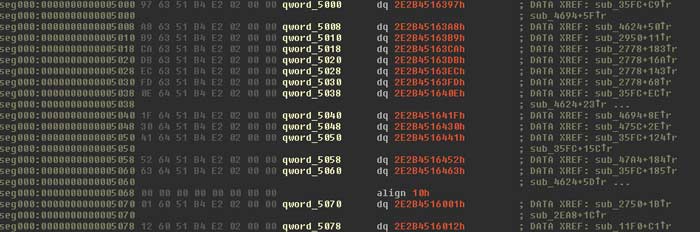
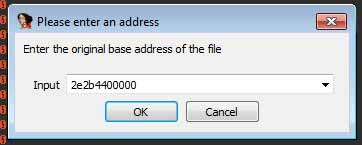
The script shared will fix the import address table to provide more meaningful function names. First, the user is prompted for the correct base address of the dumped code so that it rebases it in IDA.
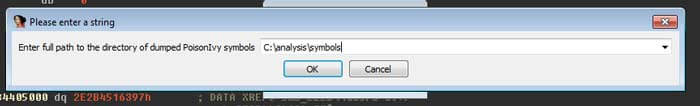
Following rebasing, the script will prompt for the directory of symbol exports:
It will then take a while importing the symbols and creating the enumerations. Following this, the script will prompt for the start address of the import address table.
It’s easier to just scroll to the start of the table before running the script as the prompt will, by default, have the value of the current screen address (obtained using ea()). A future version could remove this prompt and so the start of the table is found using xrefs.
Following this we should see a formatted table like below:
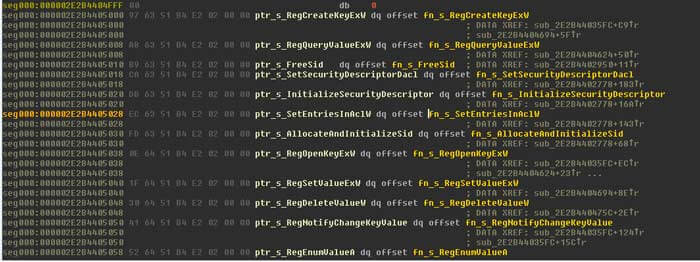
Finally, when viewing the code in IDA, we now get a useful indication of what is going on:
I hope you found this useful. In a future blog, I intend to share another walkthrough to decode the strings in Poison Ivy.
You can find me on Twitter @pengwinsurf.
References
[1] https://blog.fortinet.com/2017/08/23/deep-analysis-of-new-poison-ivy-variant
[2] http://blog.jpcert.or.jp/2017/02/plugx-poison-iv-919a.html
[3] http://blog.talosintelligence.com/2017/07/unravelling-net-with-help-of-windbg.html
[4] https://github.com/nccgroup/Cyber-Defence/blob/master/Scripts/poison_ivy_api_name_fix.py
Published date: 31 August 2017
Written by: Ahmed Zaki