Let’s kick this off with some examples. Here’s a seamless loop illustrating CBC-mode encryption:
Here’s a clip showing a code block being rewritten to avoid leaking padding information in error messages:
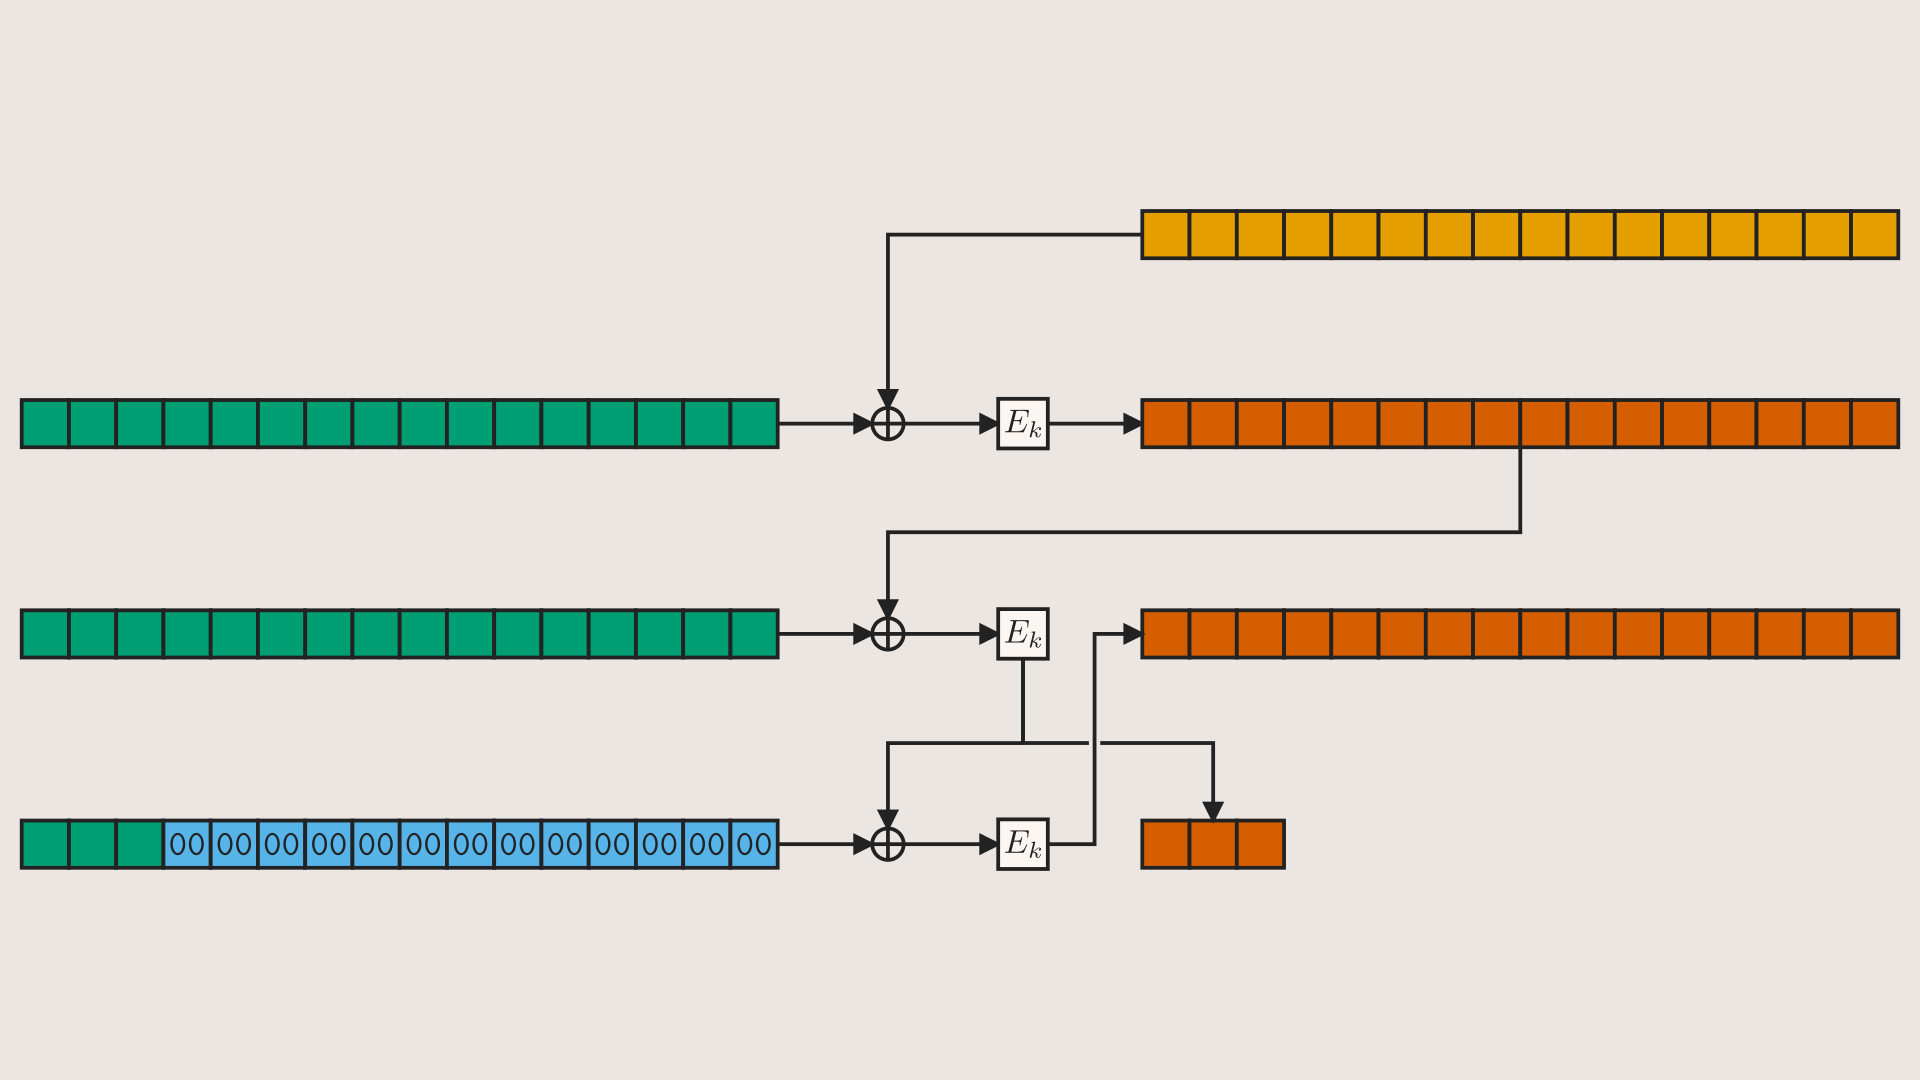
Here’s an illustration of a block cipher operating in CTS mode:

You may be surprised to learn that each of these illustrations was generated from ≤30 lines of code (30, 9, and 23 lines, respectively), without any golfing. The exact code used can be seen in the Cranim example gallery, along with many other examples of what this toolkit can do.
But let’s take a step back. You may be familiar with the Cryptopals Guided Tour. These longform videos discuss various topics from cryptography, loosely following the path laid out by the cyptopals challenges, and starting with set 2 I began to bring in custom-made visual aids to support discussion as the concepts involved grew more abstract.
To create these visuals, the tool I reached for was Manim, a math visualization library best known for its use in 3Blue1Brown‘s videos (in fact, he is also Manim’s original author). But while this library is very powerful (seriously, check out their example gallery), it is biased towards math, not computer science. It lacks support for such basic tasks as visualizing (or rewriting) a buffer; drawing a wire diagram; modifying a code snippet; and so on. To adapt this library to my use case, I had to write an extensive plugin adding all this functionality and more. Today I am releasing this plugin, cranim, in the hope that it will be useful to other computer science educators. You can find installation and usage guidelines in the GitHub repo: https://github.com/nccgroup/manim-cranim
The default color scheme is optimized for accessibility; contrast between colors should be clear even to colorblind viewers. This color palette was originally published for use by data scientists in multicolor figures. The default background color, a warm and pleasant off-white, is similarly meant to promote legibility: studies have shown that dark text on light backgrounds scans faster and more accurately than the inverse. The precise tone of the background is intended to evoke a poorly-cleaned whiteboard, a familiar sight to any computer science student.
While the toolkit is oriented towards animations, Manim is equally capable of producing static images such as the illustration of CTS mode above; in cases where vector graphics are preferred, Manim can both consume and produce SVG files. The subset of Manim used by Cranim exclusively uses vector representations internally, making it a good fit for this use case.
Cranim is still under active development (as is the Guided Tour), so I have not yet written API docs; they will come as the API stabilizes. However, I keep the Example Gallery up to date, so you can turn to it for simple examples of idiomatic usage. If you’re interested in a less trivial example, the full source code for the animations used in the 17th Guided Tour video can be found in this gist (though note that parts of it are hacky, as it was written quickly and has not been reviewed or edited; in this sense it closely models the sort of code the average Cranim user might write).
If you make something with Cranim, please feel free to send it my way! I’m curious to see what uses people find for this tool, and I’m happy to take feature requests (or bug reports) on GitHub as well.
