tl;dr
Liam Stevenson, Associate Director of Technical Services within NCC Group’s Managed Detection Response division, shows how to derive significant cost efficiencies in SIEM platform consumption with smart log ingestion utilising pre-processing data pipelines and modern cloud services. Doing so significantly reduces data volumes to the SIEM without loosing the residual value and accessibility of the underlying data.
Log Reality
It is very common that an organisation keeps their logs (or a subset of them), often forwarding them to a Security Incident and Event Management (SIEM) system. There are a few main drivers for doing so:
- Log Retention — frameworks such as PCI DSS require you to store your log data for a period
- Threat Detection — doing analytics on log messages to produce meaningful detections for analysts to investigations
- Threat Hunting/Incident Response — for looking back at historic artifacts related to threats and incidents
The SIEM Tax
SIEMs are useful platforms for correlating events and doing analytics on log data, but all come with a license cost. Some SIEMs license by volume of data ingested (such as Splunk or Microsoft Sentinel) or by Events Per Second (such as LogRhythm or ArcSight).
As such it is within a blue teams interest to keep down the cost of a SIEM, as the money can then be invested elsewhere. As such we should only aim to store what we need to in the SIEM whilst retaining the residual value with the remaining data in cheaper storage solutions. There are a number of scenario’s where these cost savings are possible but I’ll walk through one in this blog post to demonstrate and quantify the effectiveness of this strategy.
Did you see that?
Consider the following scenario as a practical example to demonstrate the concepts:
- You collect a high volume of firewall log data a day from across your estate
- You must keep this data for regulatory reasons for 12 months and wider investigations
- The only detection capability you use these logs for is matching against threat intelligence derived Indicators of Compromise (IoCs)
One way we could solve this value challenge is to do the Indicator of Compromise (IoC) matching outside of the SIEM and only forward entries that are relevant to the SIEM workflow while storing everything compressed in an Amazon AWS S3 bucket or Microsoft Azure blog storage.
The Setup
In order to demonstrate the above scenario in practice we need a few things:
Data
For this we elected to use some of the Boss of the SOC v1 data provided by Splunk (https://github.com/splunk/botsv1), in particular the Fortinet traffic logs. This data set is very good to do experimentation with; it’s open source and available in a JSON format as well as an indexed Splunk format which makes it much easier to use outside of Splunk.
The Fortinet traffic logs have about 7,675,023 entries, which spread over a day would equate to just shy of 89 EPS (assuming it was spread evenly throughout the day), and is equivalent to roughly 4Gb.
In this data I already know that the IP address 97.107.128.58 appears 7 times, so we’ll select to use this IP in our simulated threat intelligence IoC list.
For this scenario we’ll also assume that this data is being streamed to a file i.e. it could be being captured by something like Syslog-NG.
Storage
Nothing too complex is required here, just an Amazon AWS S3 bucket that can be used to set to age out our data after 12 months and a Splunk instance.
If you want to follow along and set up a Splunk instance to experiment with, I’d recommend building one in docker: https://hub.docker.com/r/splunk/splunk/
Data Pipeline
There are a few tools you could use here, but in my example I’m going to use Apache NiFi (https://nifi.apache.org/) mainly because it is my go to tool when I have a data pipeline to build, easy to get going and has the ability to scale up when you want to use it in production.
Preparing the data
Before anything, we need to clean that BOTSv1 data — I’ve previously written a tool to clean and replay the event data back for me into a file which I’ll use to simulate the flow of data: https://github.com/YoloSecurity/LogCannon
The format of the data, this case, will look something like:
We can see from this gist that this date looks like CEF but isn’t valid (there is no type field in CEF).
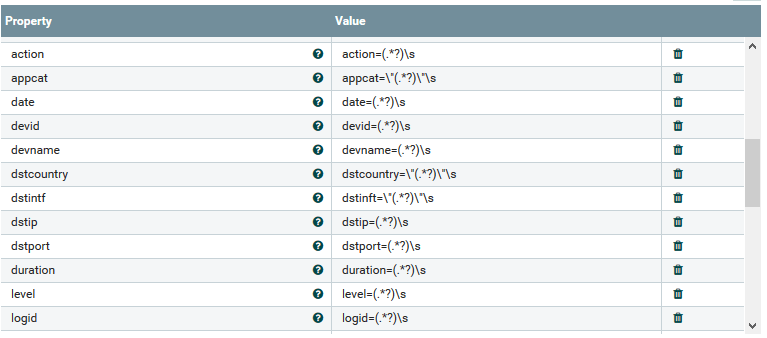
That’s okay though, key value pairs make it easy to use regular expressions to extract the data later.
The Pre-Processing Data Pipeline
Using Apache NiFi we’ll watch the file, parse the lines of data, compare it to our IoCs and convert it into JSON or send it to Splunk depending on the result. Parsing the left over data into a JSON format means you can search it in S3 even after it’s compressed. This allows you to not throw away our good pipeline work away later as you don’t have to worry about re-ingesting the data later.
Below is the flow that I set up in instance in Apache Nifi (which I ran in docker) to process the incoming log files. You can get this template to import into your own Nifi instance by grabbing the xml from this gist: https://gist.github.com/YoloSecurity/60e8f3d6da4ea61dd57b0416796a8eac
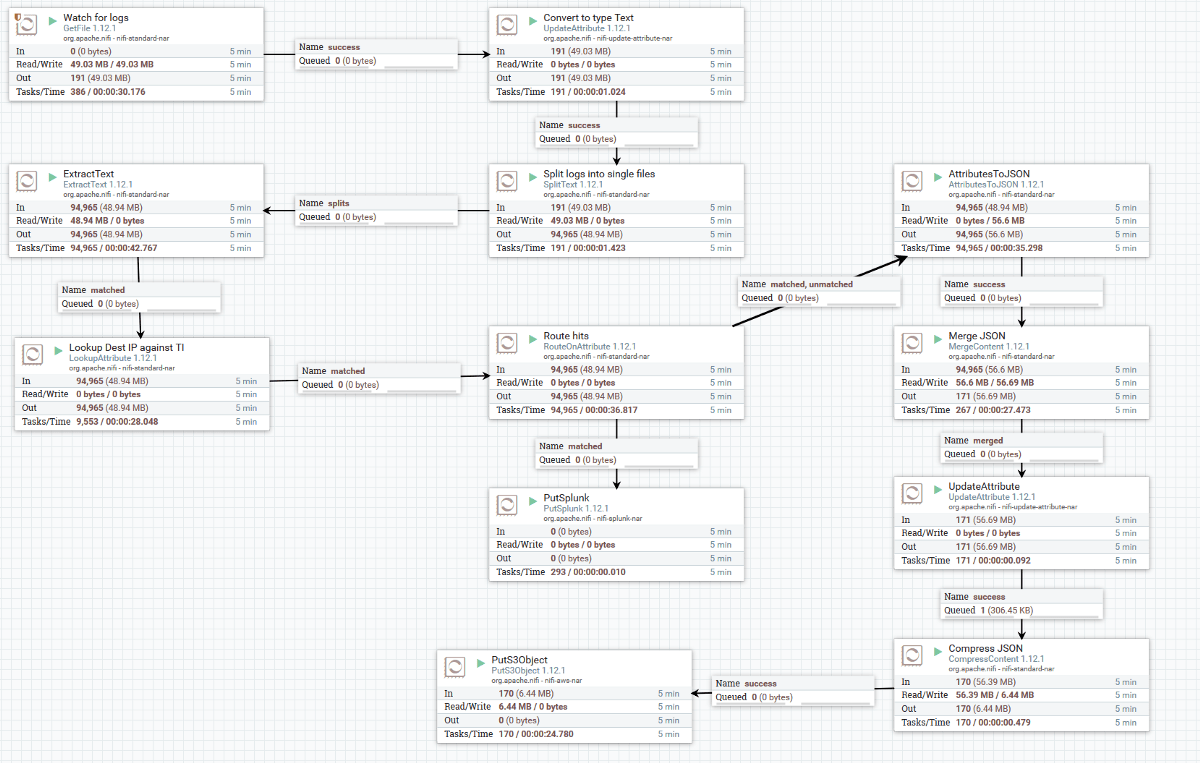
Here’s a description of how the flow works:
- Watch the file that is getting logs streamed to it. This could be replaced by a TCP or UDP listener if needed.
- Tell NiFi that these are of the mime.type “text/plain” and split each new line (i.e. each new log) into it’s own flow file.
- Extract the fields from the message and store them as attributes for the flow file:
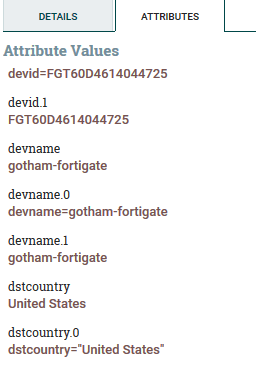
Now you can see on a flow file the attributes we’ve parsed:
4. The next module appends the attribute “threat” to each log with either the value of “yes” or “NULL”. It is configured that if any of the IP Addresses in a local CSV (which you could update from a TIP) match the dstip attribute the value stored along side it should be added to the “threat” attribute. In this case my CSV simply looks like:
ip,threat
97.107.128.58,yes
5. Route Hits sends a copy of the logs which contain the value “yes” to the “PutSplunk” module, which inserts them into a Splunk instance.
6. All logs, both hits and non-hits, then have their attributes converted to JSON which is kept in the flowfile contents, overwriting the original.
These entries are then merged back together so we have fewer (a minimum of 100), bigger flow files, like so:
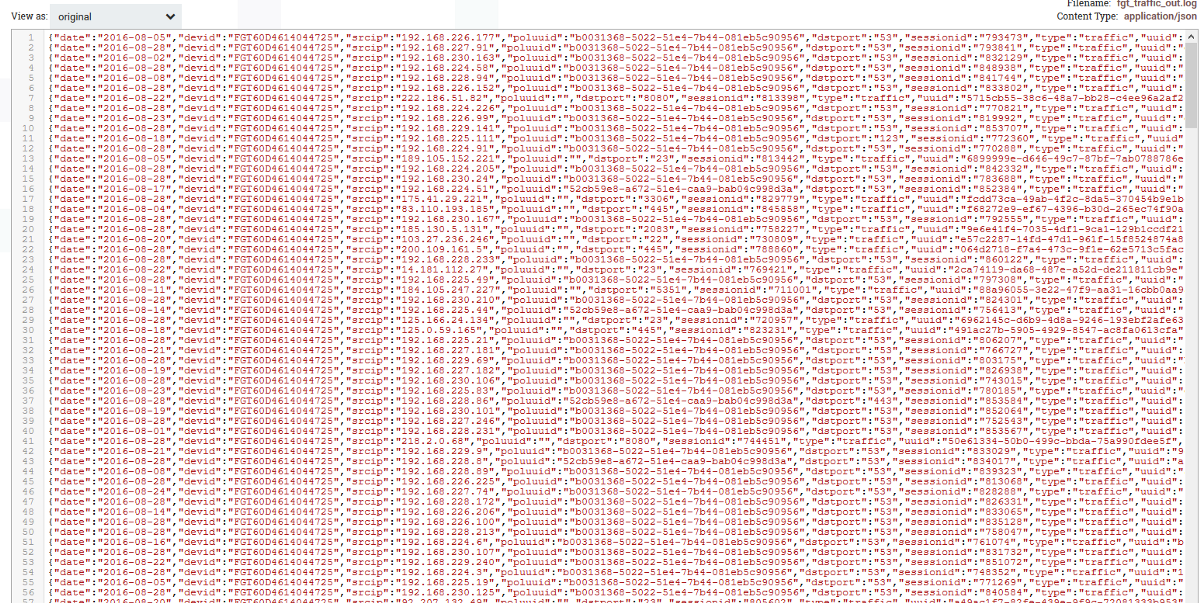
7. These files are then renamed with to include a timestamp, compressed in a minimum of 100 files and shipped to an S3 bucket.
The compression ratio is configurable but the greater the compression the greater the performance cost. In my example I experimented and set my compression level to 3 as it had the best tradeoff between space and CPU overhead.
The Result
As predicted, 7 of our log entries had the destination IP address of 97.107.128.58 and as they are key/value pairs, Splunk parsed them out of the box:
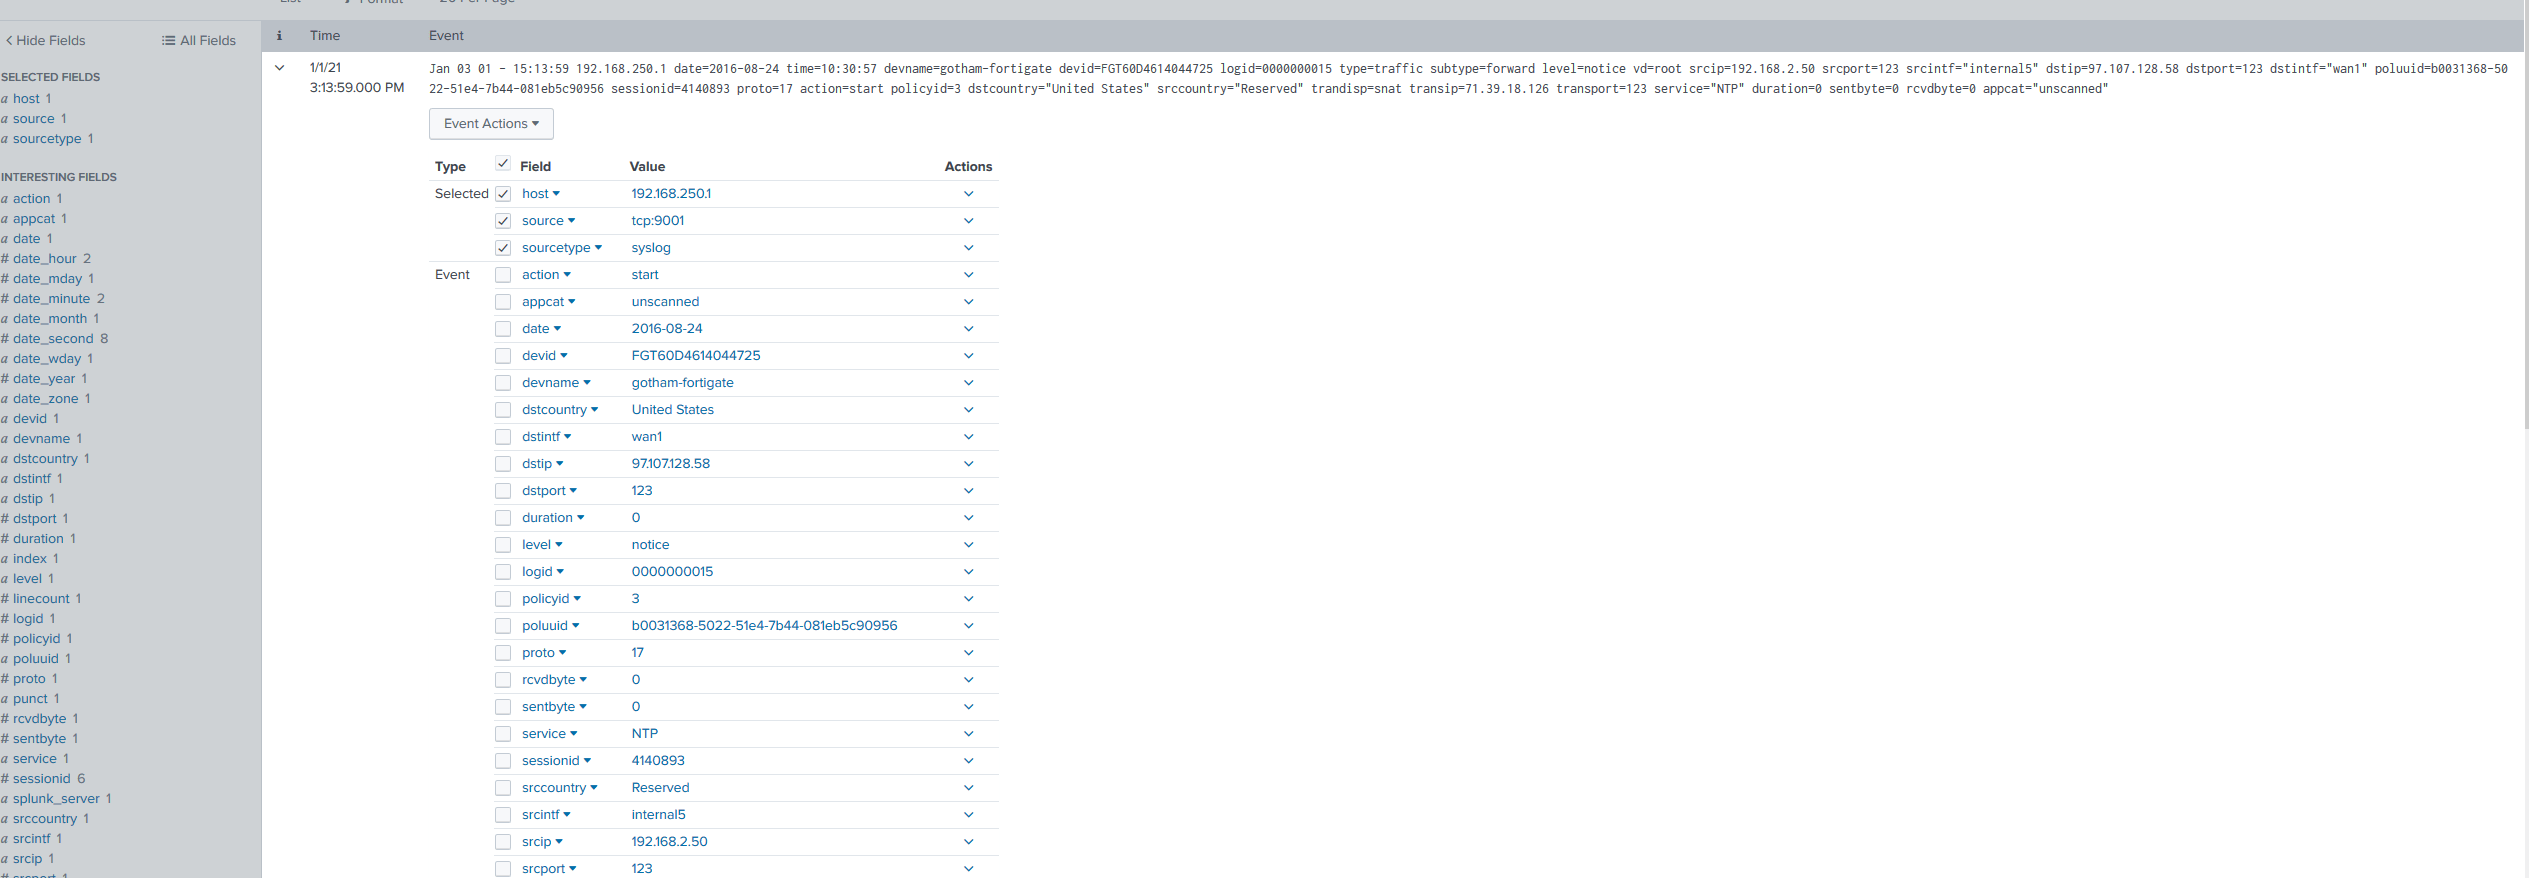
This effectively reduced my 7,675,023 events a day to 7 which in practical licensing terms meant:
- My 4Gb of license usage ear marked for the logs I had no other use for was reduced to 0.002685 Mb.
- My approximate 89 EPS was reduced to around 0.000008 EPS.
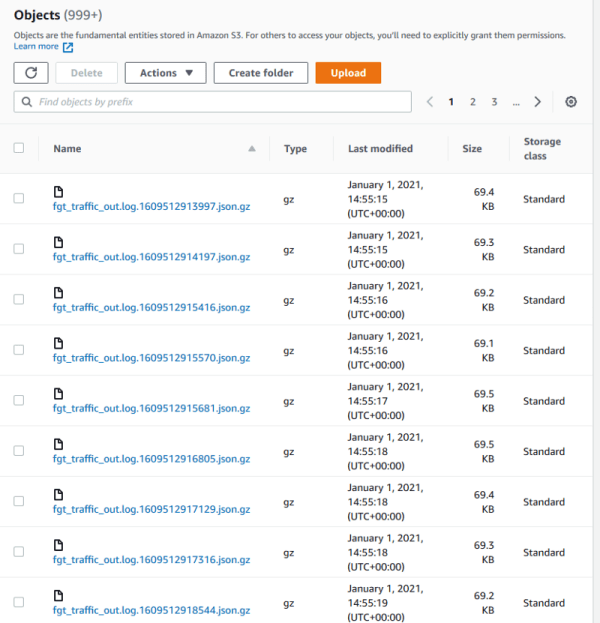
In addition, the logs in S3 storage were seeing roughly a 90% size reduction in S3 (results will vary depending on the compression level setting):
These compressed logs can be searched by the Amazon AWS Athena or Microsoft Data Lake Analytics services depending. While these services cost to use, if done correctly will dramatically reduce total cost of ownership.
