Authored by: Jesús Miguel Calderón Marín
Introduction
Two years ago I carried out research into online casino games specifically focusing on roulette. As a result, I composed a detailed guide with information on classification of online roulette, potential vulnerabilities and the ways to detect them[1].
Although this guideline was particularly well-received by the security community, I felt that it was too theoretical and lacked a real-world example of a vulnerable casino game.
With this, I decided to carry out research on a real casino game in search of new vulnerabilities and exploit techniques. In case of success, I planned to share the results with the affected vendor[2] and afterwards with the community.
While I was looking for a target I had a look on a particular variant of the casino game ‘Wheel of fortune’. The wheel is spun manually by a croupier and not by any automated system. That caught my eye and made me think about the randomness of the winning numbers. Typically, pseudo random number generators (PRNGs) are one of the main targets when it comes to game security assessments. However, there is no a PRNG in this case. Apparently, the randomness relies on the number of times the croupier spins the wheel, which, in turn, depends on their arm strength among other properties. The question that immediately came to my mind was whether a croupier is a good ‘PRNG’?
Summary
IMPORTANT NOTE. For security reasons and in order to keep confidential the identity of the vendor and game affected, some data has been redacted or omitted and the name of the game was changed to a generic one (Big Six). In addition, screenshots of the real wheel and croupiers have been substituted by similar images specially created for this purpose.
Bix Six is a casino game based on Wheel of Fortune game. Briefly, it is a big vertical wheel where the player bets on the number it will stop on [3].
According to this security analysis, the outcome of the Big Six game is predictable enough in order that the house edge could be overcome and consequently a profit could be made in the long run. Generally speaking, croupiers unconsciously tend to spin the wheel a specific number of times hence the dispersion of the number of spins is too small. Consequently, some positions of the wheel had higher chances of winning and a player could benefit by betting on these positions.
Table of Contents
The rules
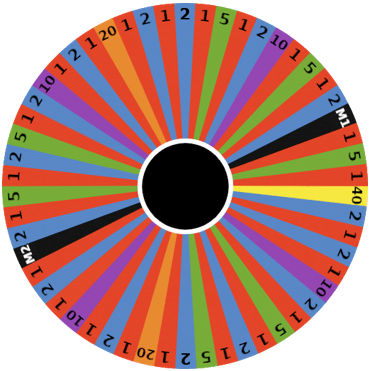
The wheel is comprised of 54 segments. The possible outcomes on the wheel are 1, 2, 5, 10, 20, 40, multiplier 1 (M1) and multiplier 2 (M2).
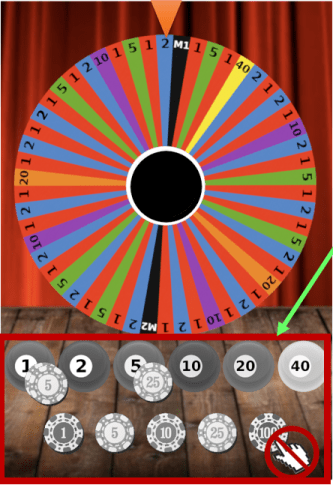
Players bet on a number they think the wheel will land on and then the croupier spins the wheel. The bets must be placed within the table limits, which are shown on the screen. The colour around the countdown indicates when players can place bets (green), when betting time is nearly over (amber) and when no further bets can be placed for the current round (no countdown).
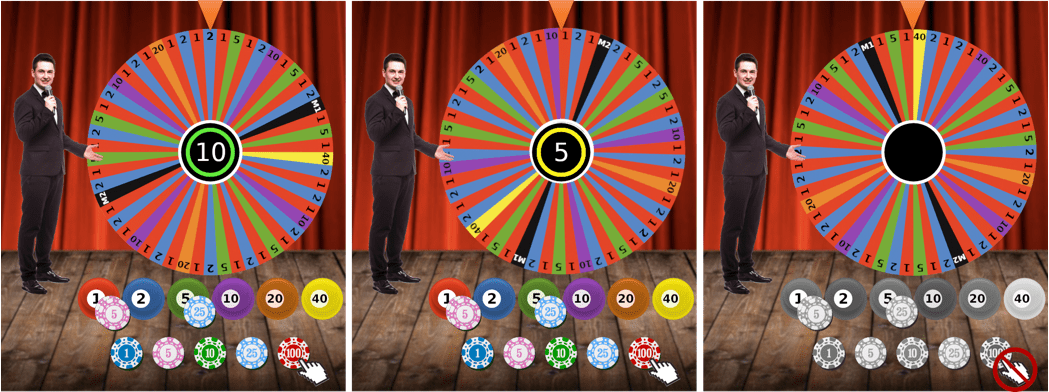
It is worth mentioning that the croupier starts spinning the wheel before the betting time is over and continues doing it for several seconds once the betting time is over and the betting panel is no longer available.
Some spins after, the winning number is determined and pay-outs are made on winning bets.
Odds and pay-outs
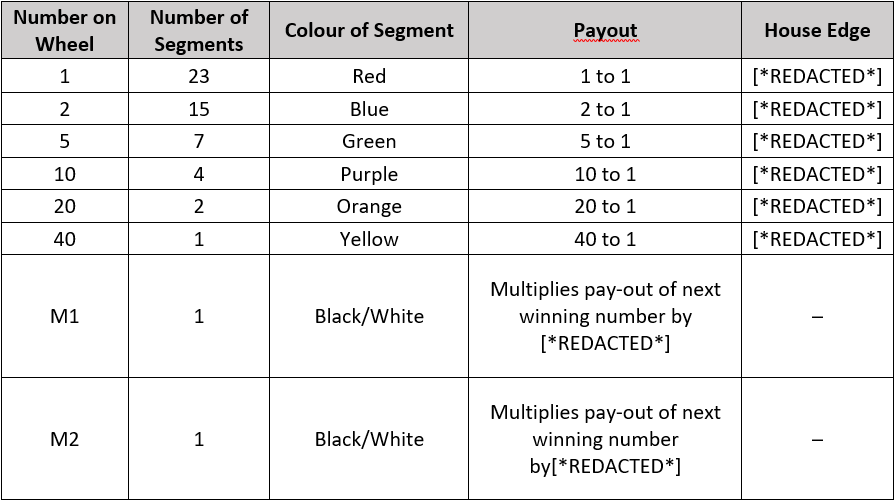
The wheel can stop on the numbers 1, 2, 5, 10, 20 and 40. The pay-out of each segment is a bet multiplied by its number plus the stake. For example, if a player bets 15 pounds on number 10 and this turns out to be the winning number, the player is paid 165 pounds (15 x 10 + 15).
The segments M1 and M2 are multiplier segments, which makes the game more interesting. If the wheel stops on any of them, new bets are not accepted, and the wheel is spun again. However, any wins on the next spin are multiplied by [*REDACTED*] or [*REDACTED*], according to the multiplier the wheel stops on in the original spin. If the wheel stops on two or more multipliers, the final win is increased by as many times as all the multipliers before indicate.
The table below shows the number of stops, pay-out and house edge for each possible outcome:
Wheel tracker
A script was developed to record the behaviour and the outcome of the Bix Six online game. The obtained data included inter alia, initial speeds of the wheel, croupiers and winning numbers.
7,278 hands were recorded in April 2021 and subsequently analysed. The figures below show some of those hands.
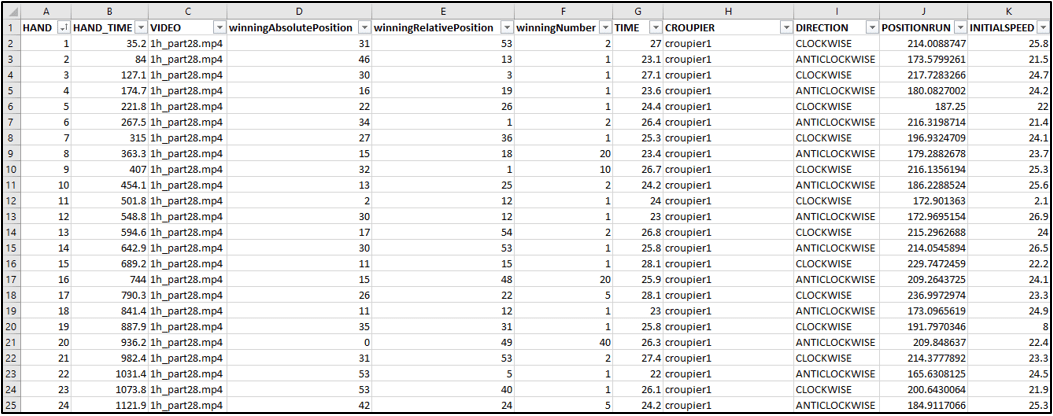
Among most relevant data for analysis, the following is included:
- winningNumber – the winning number displayed on the wheel as an outcome of every hand (1, 2, 5, 10, 20, 40, M1, o M2).
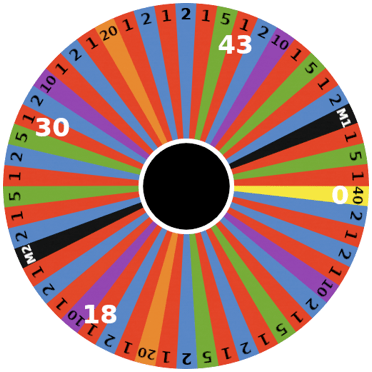
- AbsolutePosition – unique number to identify unambiguously every segment. E.g. the yellow segment has the absolute position 0. This does not vary from hand to hand unlike relative positions (see the definition below).
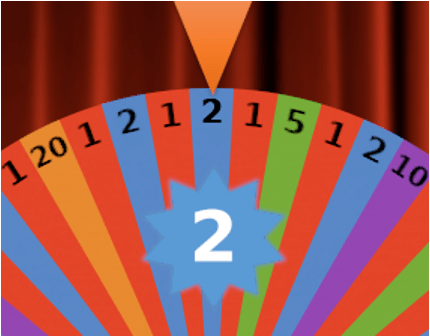
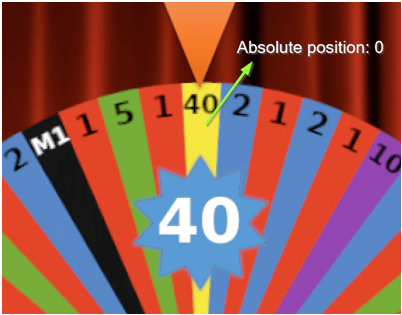
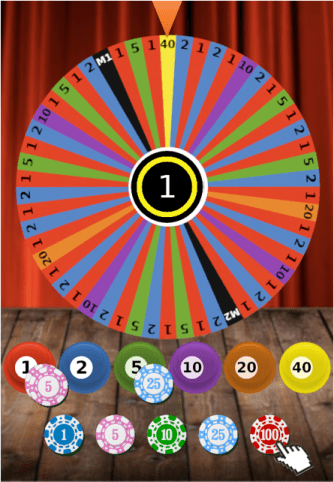
- winningAbsolutePosition – the absolute position of the segment of the winning number. The following picture shows the winning number 40, which has the absolute position 0.
- direction – the direction in which the wheel is spun. The value assigned to it is whether ‘CLOCKWISE’ or ‘ANTICLOCKWISE’.
- positions_run – identical to the number of the wheel spins multiplied by 54 (the number of segments the wheel is divided into). For instance, if the wheel spins 1.5 times, the value of this variable will be 81 (1.5 * 54).
- HAND_TIME (Initial position) – The moment in the video when the hand starts (e.g. 35.2 seconds from the beginning of the recording). This coincides with the instant before the betting panel is disabled and no longer available until the next game (specifically 0.5 seconds before). The position of the wheel at this moment will be referred to as the initial position from now on.
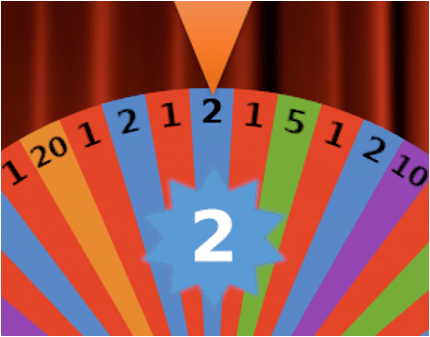
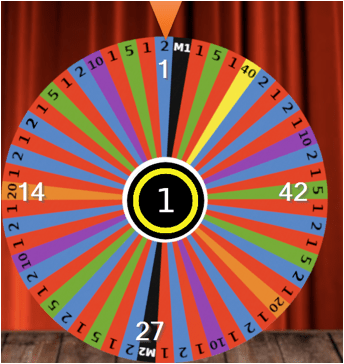
- Relative positions – unique numbers to identify the segments of the wheel which are assigned at the initial position beginning from the segment on the top (position 1), followed by the next segment (position 2), etc. The next segment is on its left if the direction is clockwise or on its right if the direction is anticlockwise.
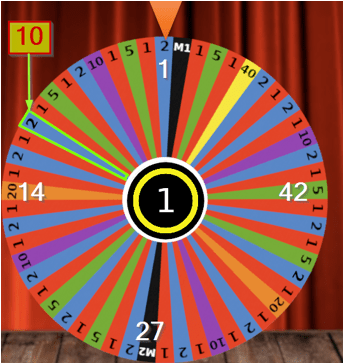
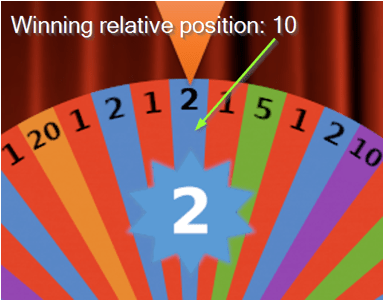
- winningRelativePosition – defines the relative position of the segment containing the winning number. It can be calculated using the following formula: round(positions_run % 54, 0) + 1. E.g. in the figures below, the blue segment that is in the relative position number 10 is the winning one. Therefore, the winning relative position is 10 for this hand.
Wheel behaviour analysis
The values of the variables ‘winningAbsolutePosition’, ‘winningNumber’ and ‘winningRelativePosition’ have been analysed to establish the fact that they are random. In order to do this, the chi-square test of independence have been used to ascertain whether the difference between the analysed numbers distribution and the expected distribution is attributed to good luck or, on the contrary, to the lack of randomness, which could be eventually exploited by a malicious player. Should any further information about the method be required, the reference added to this document could be consulted [1][2].
Variables winningNumber and winningAbsolutePosition
The variables ‘winningNumber’ and ‘winningAbsolutePosition’ have successfully passed the test. Particularly, in case of ‘winningNumber’ the chi-squared statistic was 4.48. The critical value for the distribution chi-square with 7 degrees of freedom and the level of significance of 1% is 18.47[3]. As the critical value is significantly higher than chi-squared statistic (4.48), it is impossible to state that winning numbers are not random.
Similarly, the statistics for ‘winningAbsolutePosition’ was 32.18, which is much less than the critical value 79.84 (53 degrees of freedom and a level of significance of 1%). This implies that it cannot be stated that there is difference in size of the segments or the wheel is biased.
Variable winningRelativePosition
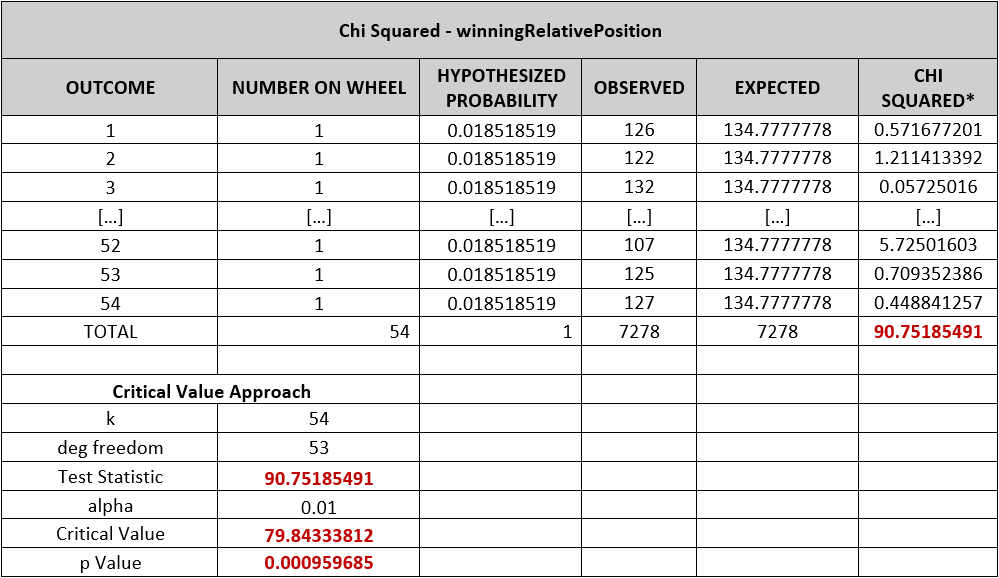
However, as for the parameter ‘winningRelativePosition’, it is notable that some positions win more frequently than others do, which could make it possible for a player to overcome the house edge and benefit from it. According to the collected data, the chi-squared statistic is 90.75 and exceeds the critical value 79.84 (53 degrees of freedom and a level of significance of 1%). In addition, the p-value (probability of obtaining test results at least as extreme as the results actually observed) [4] is 0.095%. These results suggest that the parameter ‘winningRelativePosition’ is far from being random.
The table below shows that p-value is even lower in winning relative positions for hands with clockwise direction, particularly 0.00000014%.
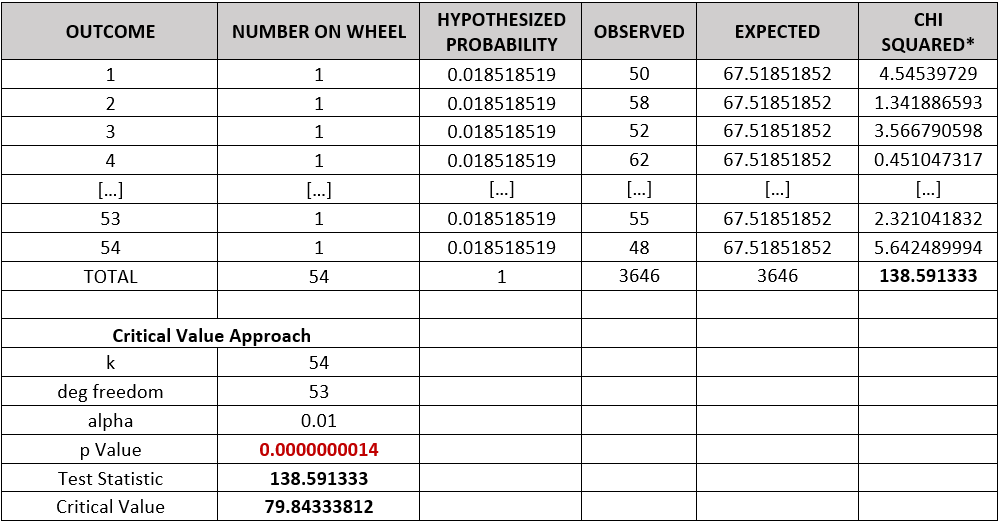
Simultaneous confidence intervals [5][6] were calculated for this last sample to ultimately know the maximum and minimum potential benefit which a player would be able to gain. In order to work this out, the Wilson score method was used with a confidence level of 90%.
It was estimated that a player has a probability of 2.15% of winning betting on the position 29 in the worst of cases. This probability considerably exceeds the expected value (1.851%) and implies a significant advantage for the player.

Exploiting lack of randomness on winning relative positions
In order to exploit the lack of randomness of winning relative positions, betting strategies have to be designed. The following two sections include betting strategies designed for clockwise and anticlockwise games, and the analysis of their efficiency in comparison with other strategies.
Betting Strategies
A very simple winning betting strategy consists in betting on number 40 if the segment (there is only one segment with number 40) is in the relative position 29 and the wheel direction is clockwise. The following shows an example of how this strategy works.
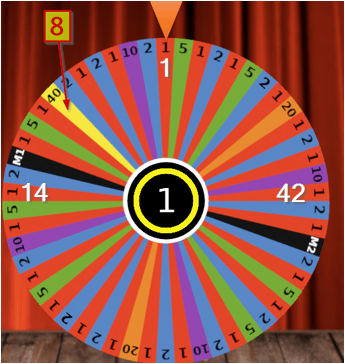
The image below shows the initial position of the wheel (this coincides with the instant before the betting panel is disabled and no longer available until the next game). Number 40 is in the relative position 8 but not in the relative position 29. Therefore, this game would be ignored, and no bets should be made.
In the following initial position, number 40 is in the relative position 29. Therefore, a bet should be made on number 40.
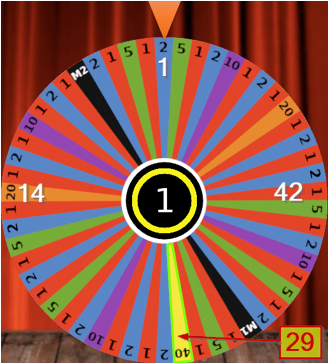
It is worth mentioning that the bets would need to be made in an automated way using a script because such tasks as identifying the number positioned in a specific relative position, and making (or not making) a bet within 0.5 seconds, are not possible to do manually.
According to the simultaneous confidence intervals calculated previously, the probability of winning would be between 2.15% and 3.01% (without taking into account the M2 and M1 segments), which considerably exceeds the expected value (1/54 = 0.0185 = 1.85%).
Taking into account the aforementioned probabilities and assuming that:
- the wheel stops on the segments ‘M1’ and ‘M2’ with probabilities 1.9% and 1.4% in the worst of the cases, and 2.71% and 2.12% in the best of the cases.
- all the segments have equal probability of winning if previously the wheel stopped on ‘M2’ or ‘M1’
- the size of the bet is always 1€ and the winning quantity limit is 500.000€
it was estimated that the player could obtain a return on betting that would range from 0.56% to 41.80% using this strategy. For instance, a player would win a minimum of 5.6€ and a maximum of 418€ per every 1000€ bet, with approximately 90% of confidence.
Notably, this strategy might require long time to obtain a ‘worthy’ benefit as most of the games are discarded because bets are only placed when number 40 is in the relative position 29.
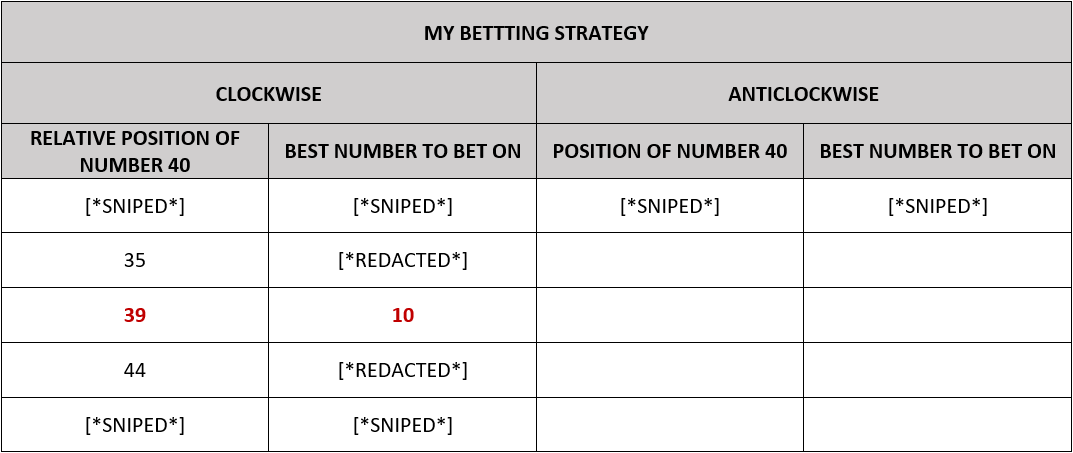
As a proof of concept, a more complex betting strategy was designed based on the estimated probabilities and expected ROI. It will be referred to as ‘MY BETTTING STRATEGY’ from now on.
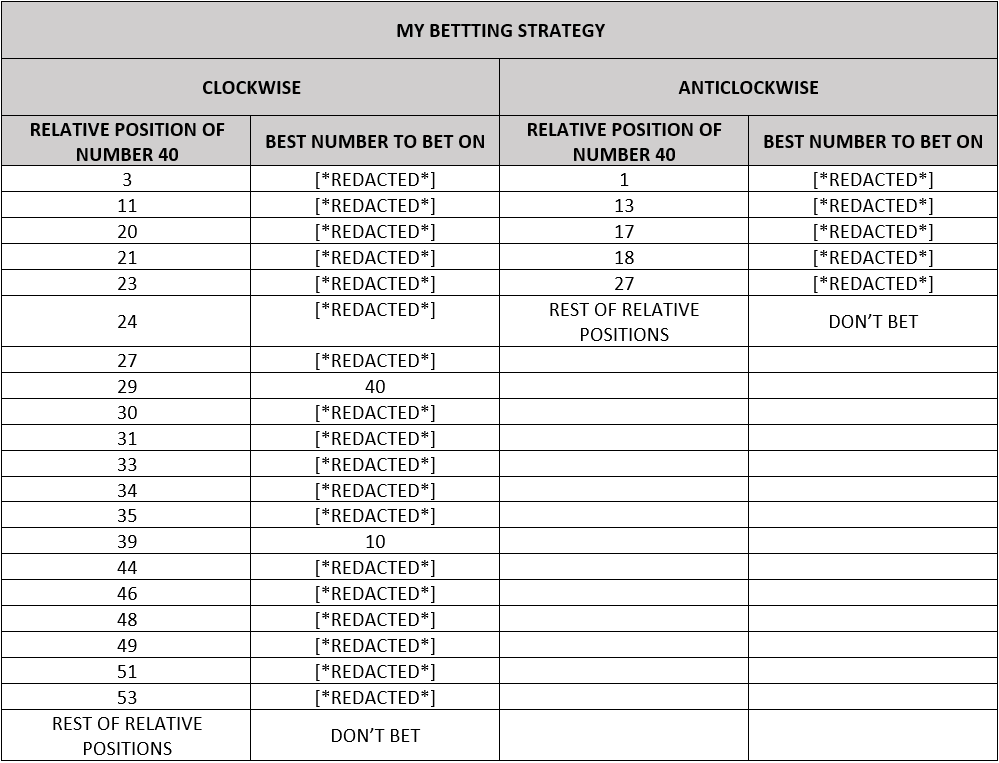
Depending on the direction (CLOCKWISE and ANTICLOCKWISE), the strategies are different.
The columns ‘BEST NUMBER TO BET ON’ contain the numbers which the player should bet on and the columns ‘RELATIVE POSITION OF NUMBER 40’ indicate the relative position of number 40.
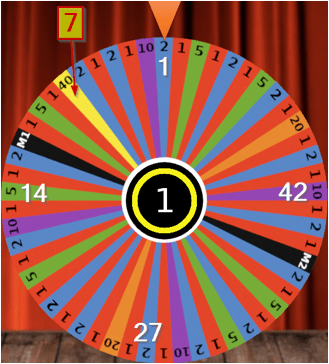
For example, if the wheel is spinning clockwise and the relative position of the segment 40 is 7 (see the image below), the player should not bet on any number.
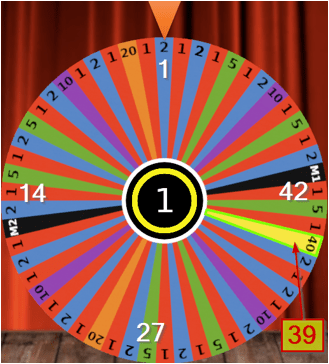
However, if the wheel is spinning clockwise and the relative position of the segment 40 is 39, the player should bet on number 10 according to the strategy (see the following image and table).
Analysing the effectiveness of betting strategies
A computer simulation of a fictitious player following ‘MY BETTING STRATEGY’ described in the previous section was run using the sample of 7.278 games (Figure 4 – Tracked hands).
For the simulation, it was assumed that:
- all the segments have equal probability of winning if previously the wheel stopped on ‘M2’ or ‘M1’
- as the winning numbers after the wheel stopping on ‘M2’ and ‘M1’ were not tracked by the script, the expected ROI was returned when the ‘winning segment’ was either ‘M2’ or ‘M1’. For instance, if following the strategy one euro is bet is on number 10 and the wheel stops on the segment ‘M2’, the total balance will be increased by [*REDACTED*] as this quantity is the expected ROI over the long run.
- the size of the bet is always 1€ and the winning quantity limit is 500.000€
The following table shows the results:

Noticed that not all the games were played. E.g. for the ‘CLOCKWISE’ direction, 1,102 out of 3,646 games were played, which means that 2,544 were ignored, as they were not profitable according to the strategy.
The balance shows the winnings (positive in both cases) and the column ‘ROI’ indicates the average money per played hand, which the player made. In other words, ROI = 100 * ‘BALANCE’ / ‘GAMES PLAYED’.
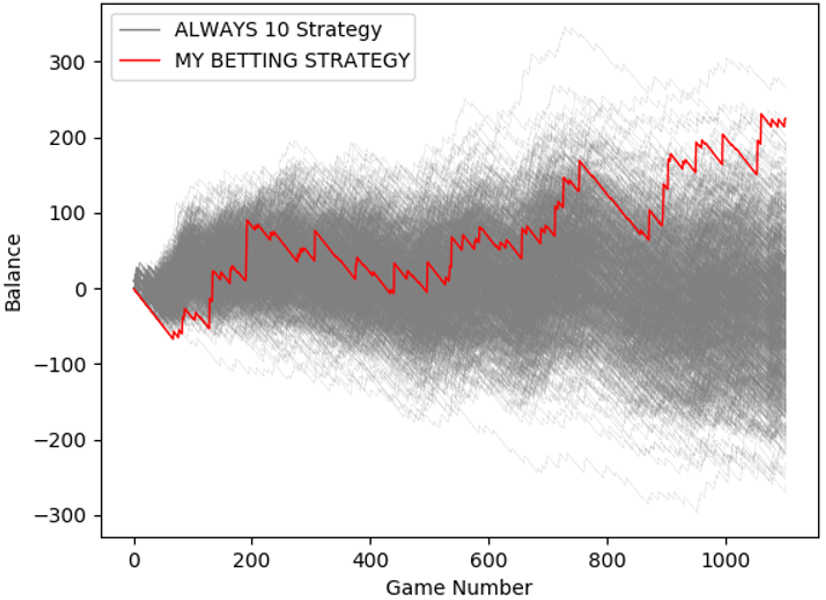
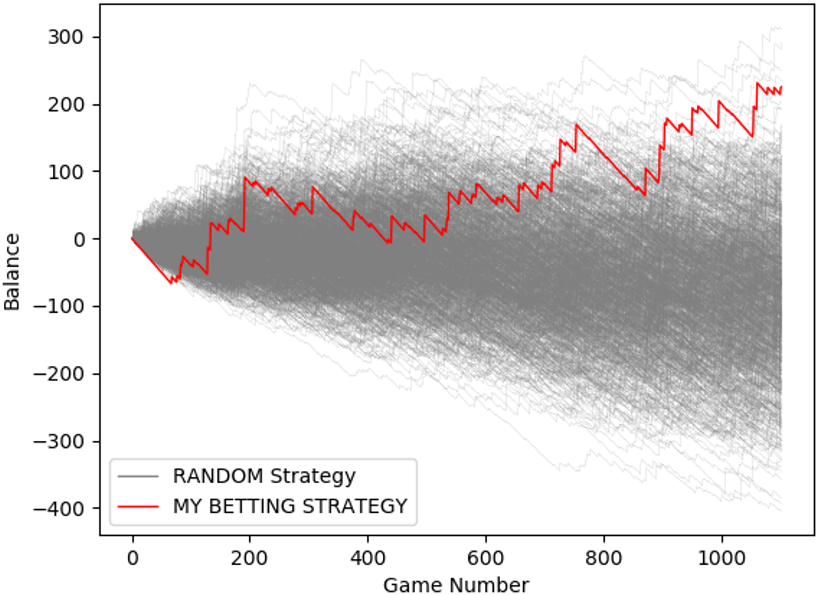
In order to determine the effectiveness of the betting strategy, the probability of obtaining a return greater than or equal to the returns obtained was worked out. Specifically, a bootstrap[7] analysis was performed to estimate the distribution of returns for the following losing strategies:
- RANDOM strategy consists in betting on any number (1, 2, 5, 10, 20 or 40) randomly.
- ALWAYS 10 strategy consists in always betting on number 10. This is a very interesting strategy to compare with ‘MY BETTING STRATEGY’, as number 10 has the lowest house edge among all the numbers, [*REDACTED*]% (see Odds and pay-outs). Therefore, ‘ALWAYS 10’ strategy is supposed to be the best strategy as it allows minimising the losses per hand.
It is worth mentioning that Monte Carlo[8] analysis was performed as well, which yielded very similar results.
The following table shows the results of the analysis:

As it can be observed, the probability of obtaining a return greater than or equal to ‘MY BETTING STRATEGY’ with the ‘random’ and ‘always 10’ betting strategies (across 1,102 and 303 games respectively) is less than 1%. This result suggests that the high effectiveness of ‘MY BETTING STRATEGY’ is far from being by luck.
The following graphs visually illustrate the effectiveness of ‘MY BETTING STRATEGY’ for the CLOCKWISE direction in comparison with the ‘random’ and ‘always 10’ betting strategies. A thousand games were simulated.
It is noteworthy that better strategies could be worked out. However, they were not explored as exploiting the lack of randomness in an efficient way was not the aim of this analysis but highlighting the fact that the house edge could be overcome.
Other Considerations
It is worth mentioning that no intrusive tests were conducted during this research. Additionally, it was not necessary to make any bets to detect or proof the potential vulnerability described in this document. The interaction with the game was limited to record videos of the wheel, which were analysed afterwards.
Other online games were found to be similar to Bix Six. Therefore, these games might be vulnerable as well.
Recommendations
It is recommended to make the necessary changes to the game in order to generate random winning relative positions. This way, it will not be possible to overcome the house edge and make profit in the long run.
The best and safest solution (probably, the most expensive to implement as well) is to replace the croupiers by hardware that randomly generates the outcome and spins the wheel with the necessary and exact strength to show the previously determined number as the winning number.
Other solution might consist in increasing the difference between the minimum and maximum number of wheel spins. According to the observations, the croupiers currently spin the wheel approximately between 2.7 times (150 segments) and 4.7 times (258 segments). This means a difference of only two wheel spins (4.7 – 2.7 = 2). Additionally, it was observed that the croupiers unconsciously tend to spin the wheel a specific number of times. Particularly, a number between 3.56 and 3.62 times (192.5 – 195.5) as can be seen in the following histogram:
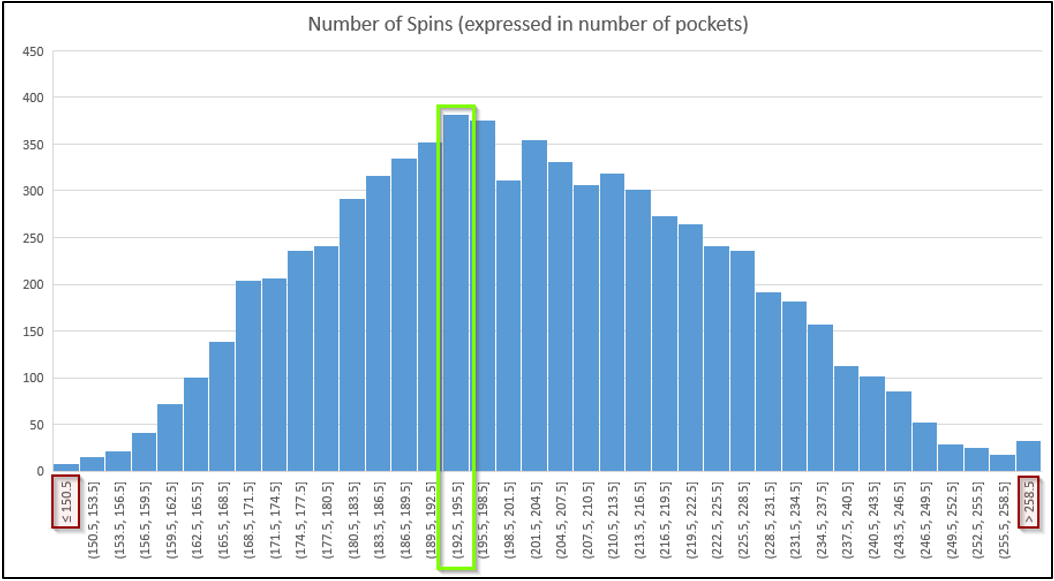
Apparently, the fact that this distribution is bell-shaped is the reason why the winning positions are not random enough. Therefore, increasing the difference between the maximum and minimum number of wheel spins will help to flatten the curve and, consequently, to obtain more random winning numbers.
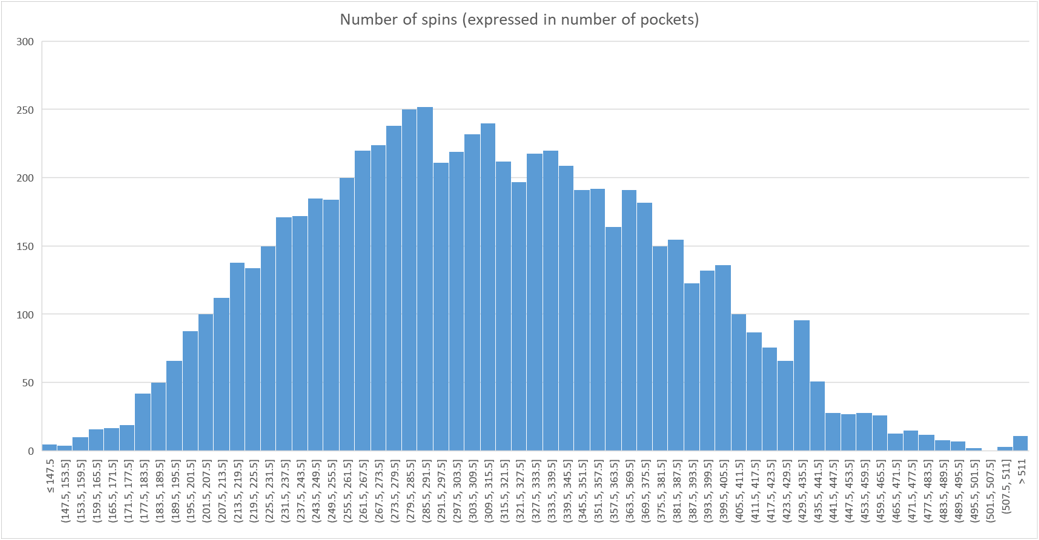
To illustrate this solution, a simulation of 7,200 wheel spins, whose numbers of segments run ranged from 147.5 to 511 (4 wheel spins difference instead of 2), was conducted. Its histogram can be seen in the image below:
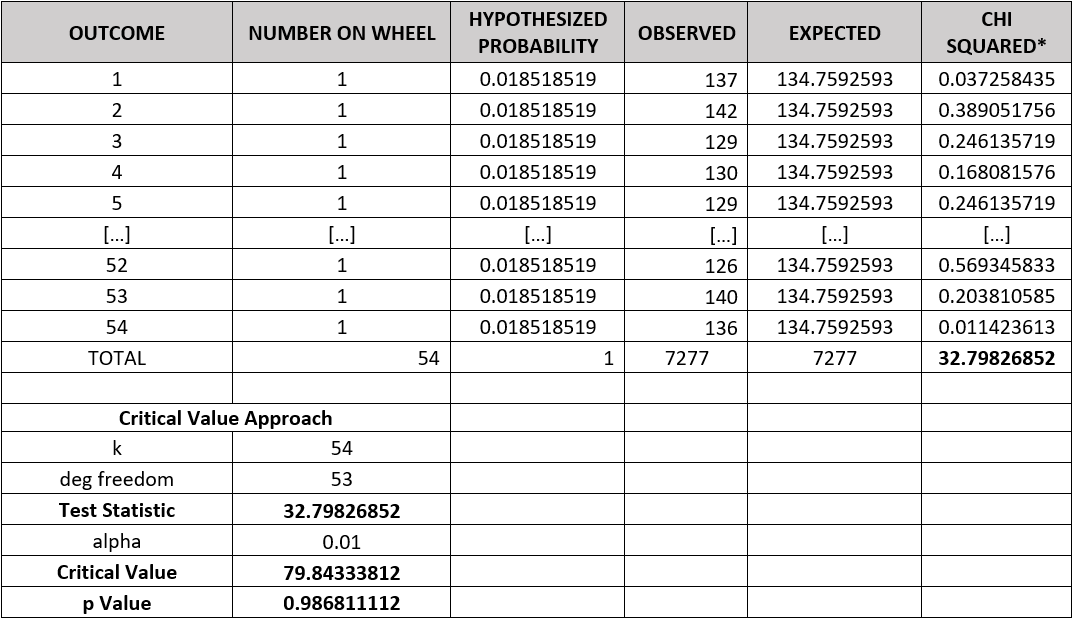
A chi-square test was conducted, and the p-value obtained was 98.6%. This result conforms well with a fair game and the deviation from expectations is well with the normal range.
Alternatively, winnings of players could be monitored and analysed statistically in real time. If a player’s winnings were unlikely to be by chance at a particular time, their accounts could be blocked temporarily and further investigation could be undertaken. Additionally, suspicious betting patterns could be monitored as well. For example, a player betting only on specific numbers (40 and 20) sporadically could be an indicative of a player trying to exploit this issue.
References
[1] Online Casino Roulette – A guideline for penetration testers and security researchers: https://research.nccgroup.com/2020/09/18/online-casino-roulette-a-guideline-for-penetration-testers-and-security-researchers/
[2] NCC Group Vulnerability Disclosure Policy: https://research.nccgroup.com/wp-content/uploads/2021/03/Disclosure-Policy.pdf
[3] Big Six – Wizard of odds: https://wizardofodds.com/games/big-six/
[4] Chi-squared distribution: https://en.wikipedia.org/wiki/Chi-squared_distribution
[5] Goodness of fit: https://en.wikipedia.org/wiki/Goodness_of_fit
[6] Chi Square Distribution Table for Degrees of Freedom 1-100: https://www.easycalculation.com/statistics/chisquare-table.php
[7] P-value – Wikipedia: https://en.wikipedia.org/wiki/P-value
[8] Confidence interval: https://en.wikipedia.org/wiki/Confidence_interval
[9] MultinomCI – Confidence Intervals for Multinomial Proportions: https://rdrr.io/cran/DescTools/man/MultinomCI.html
[10] Bootstrapping – https://en.wikipedia.org/wiki/Bootstrapping_(statistics)
[11] Monte Carlo – https://en.wikipedia.org/wiki/Monte_Carlo_method
